Android Method Trace Generation and Analysis
date
Oct 11, 2017
slug
android-method-trace-generation-analysis
status
Published
tags
Android
summary
Analyse the generation of Android method traces, including different methods to generate trace files. Write a command-line tools to run Android Method Trace on the fly.
type
Post
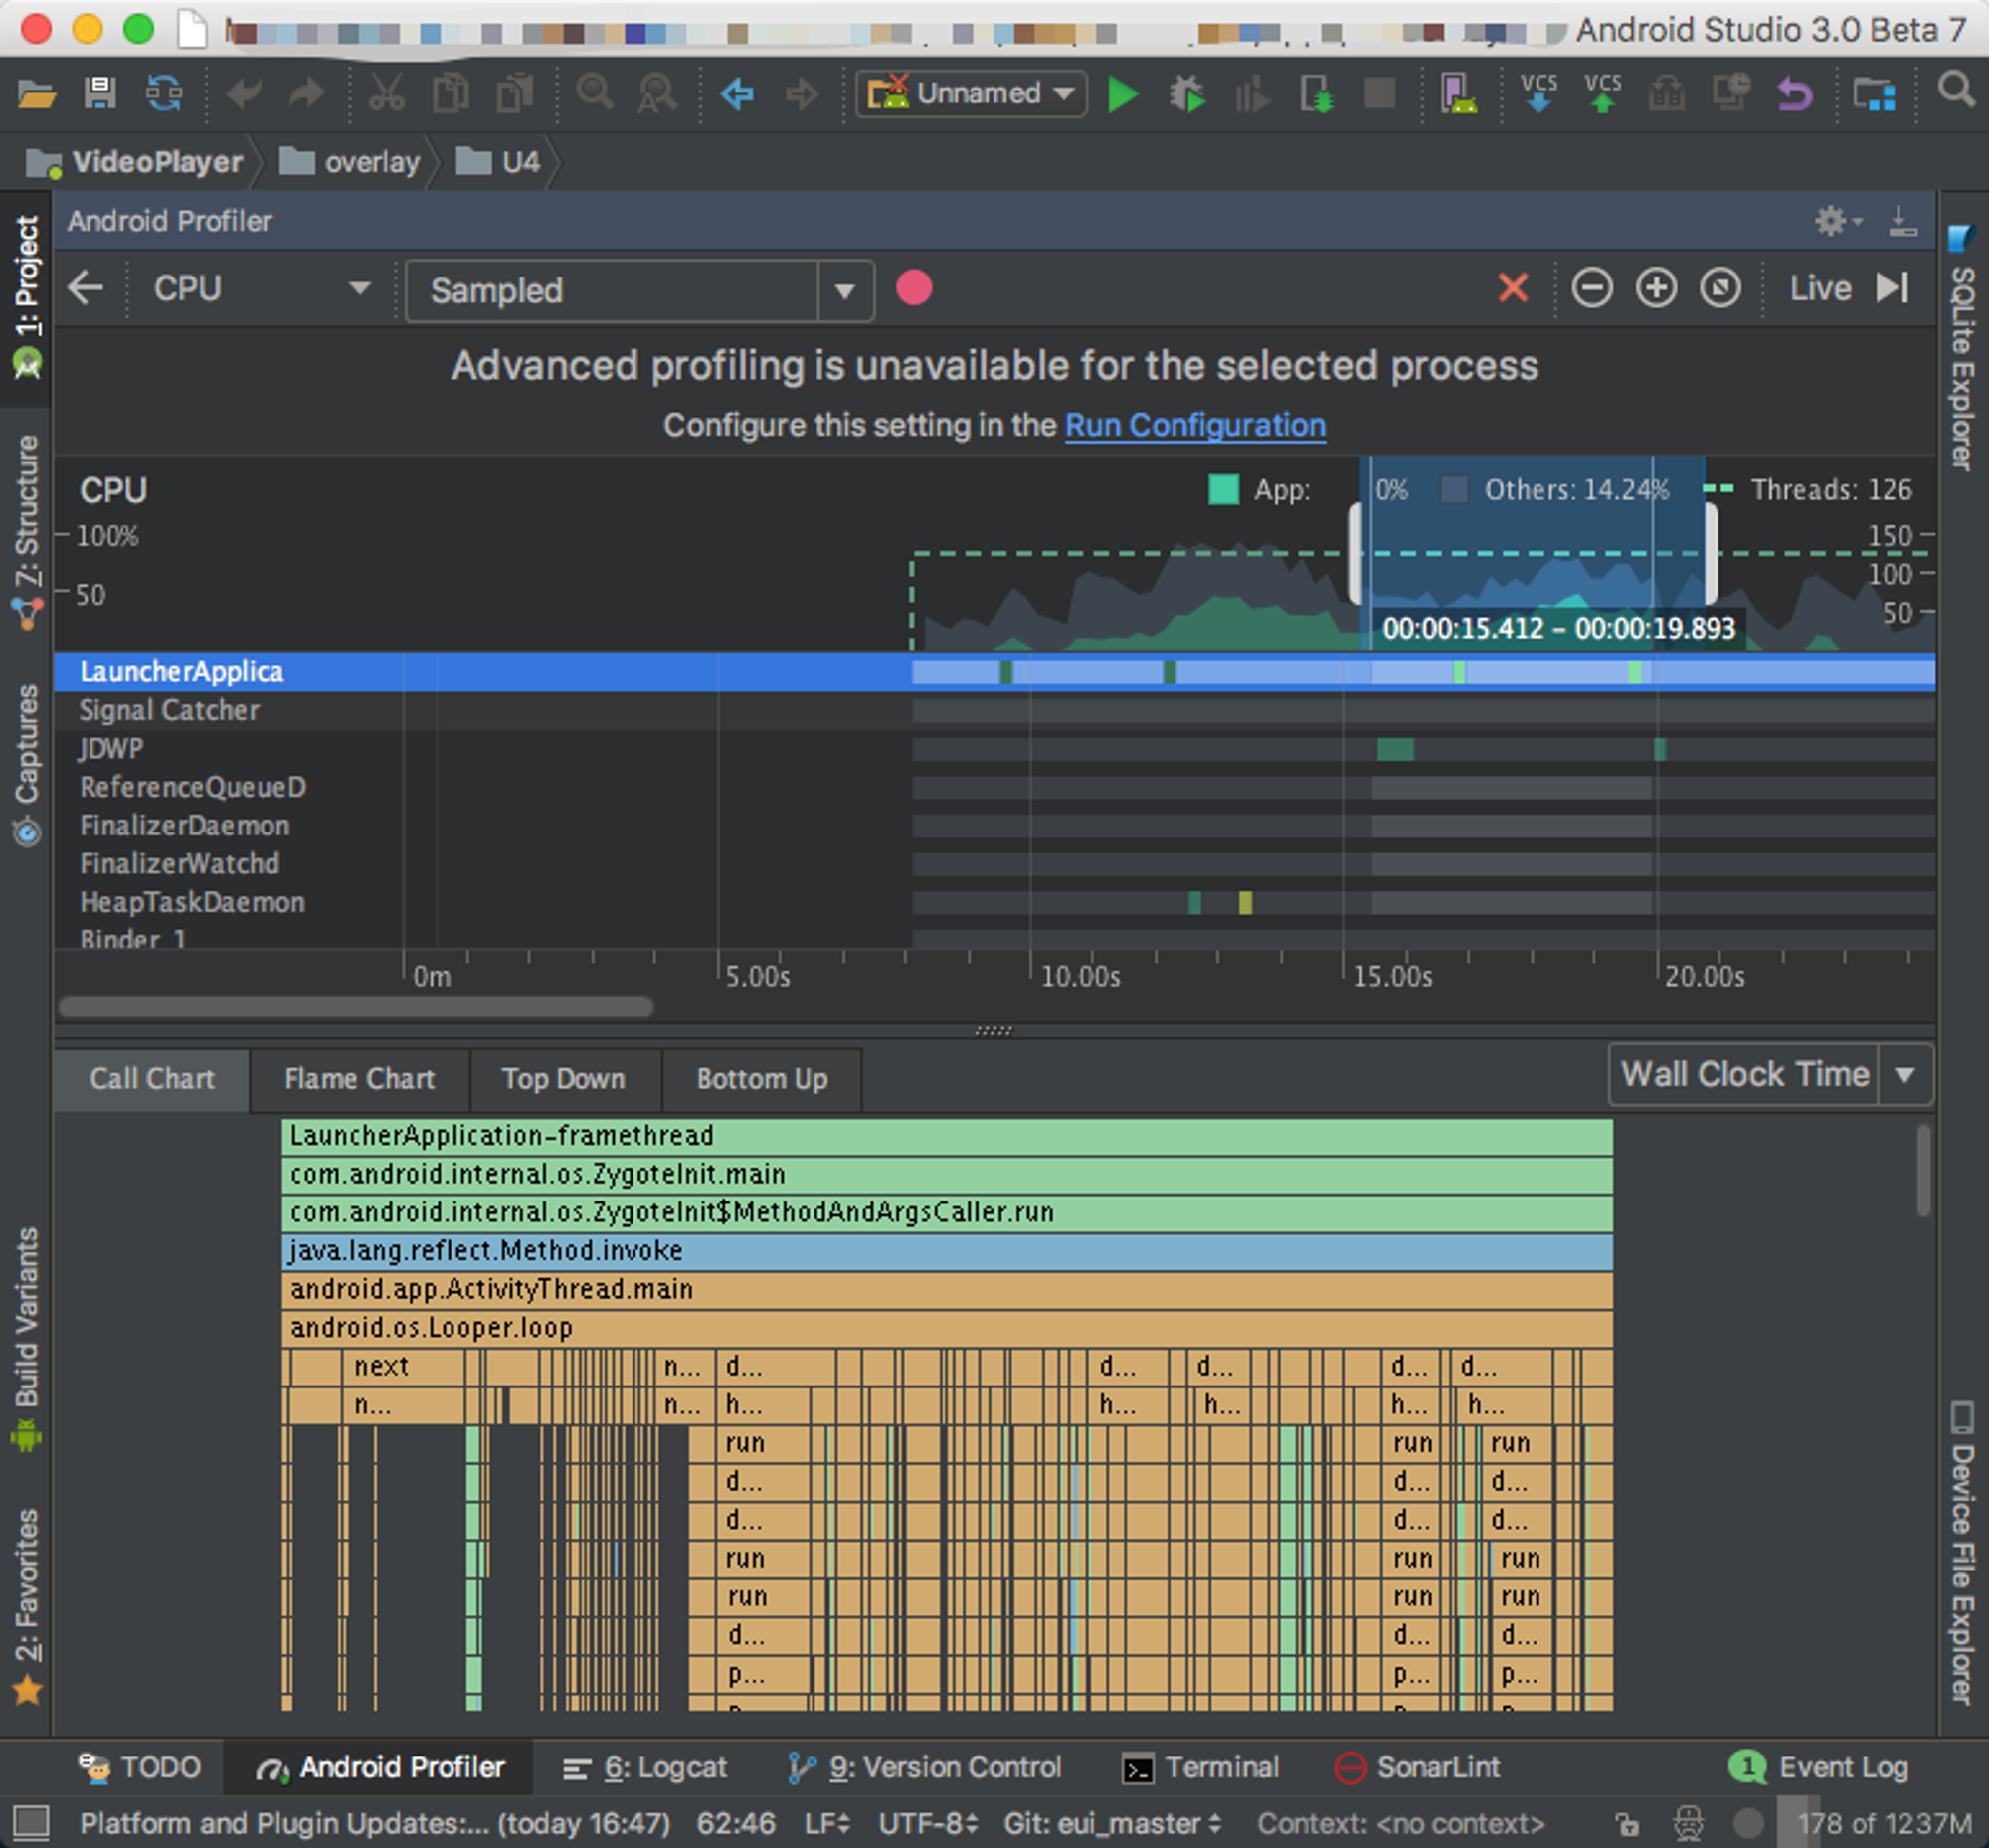
The Profiler tool in Android Studio 3.0 has made significant progress compared to the 2.0 version. I have reviewed the relevant source code and recorded the following information:
Generating Trace Files
There are two main ways to generate trace files as mentioned in the official documentation.
Code
The first method involves adding code to your project:
This will generate the trace file.
ddmlib
The second method involves using ddms/Android Monitor to manually generate the trace file. ddms relies on a library called ddmlib, which can be found in the Android SDK at tools/lib/ddmlib-*.jar.
There are not many articles available about ddmlib, but you can refer to the following resources: Hidden Boss - Getting Started with ddmlib and Using adb with ddmlib, Building Framework Libraries.
Command-line Tool
While exploring the source code, I encountered numerous challenges and wrote a command-line tool called AndroidMethodTraceRunner.
To use it, run the following command:
$ java -jar mtr.jar -p com.your.package -o output.trace -t 10 to trace for 10 seconds. Please note that it requires Java 8 to run.There are two main issues to be aware of:
AndroidDebugBridge.init(true)- If set tofalse, the client cannot be accessed.
- You must close ddms and the Studio monitor/profiler, otherwise, they will preempt the client and cause a connection failure.
Here are a few key concepts related to ddmlib:
- Bridge - adb
- Device - the connected device
- Client - the application
The main code snippet is as follows:
Android Studio
However, Android Studio 3.0 does not use ddmlib.
The general call stack is as follows:
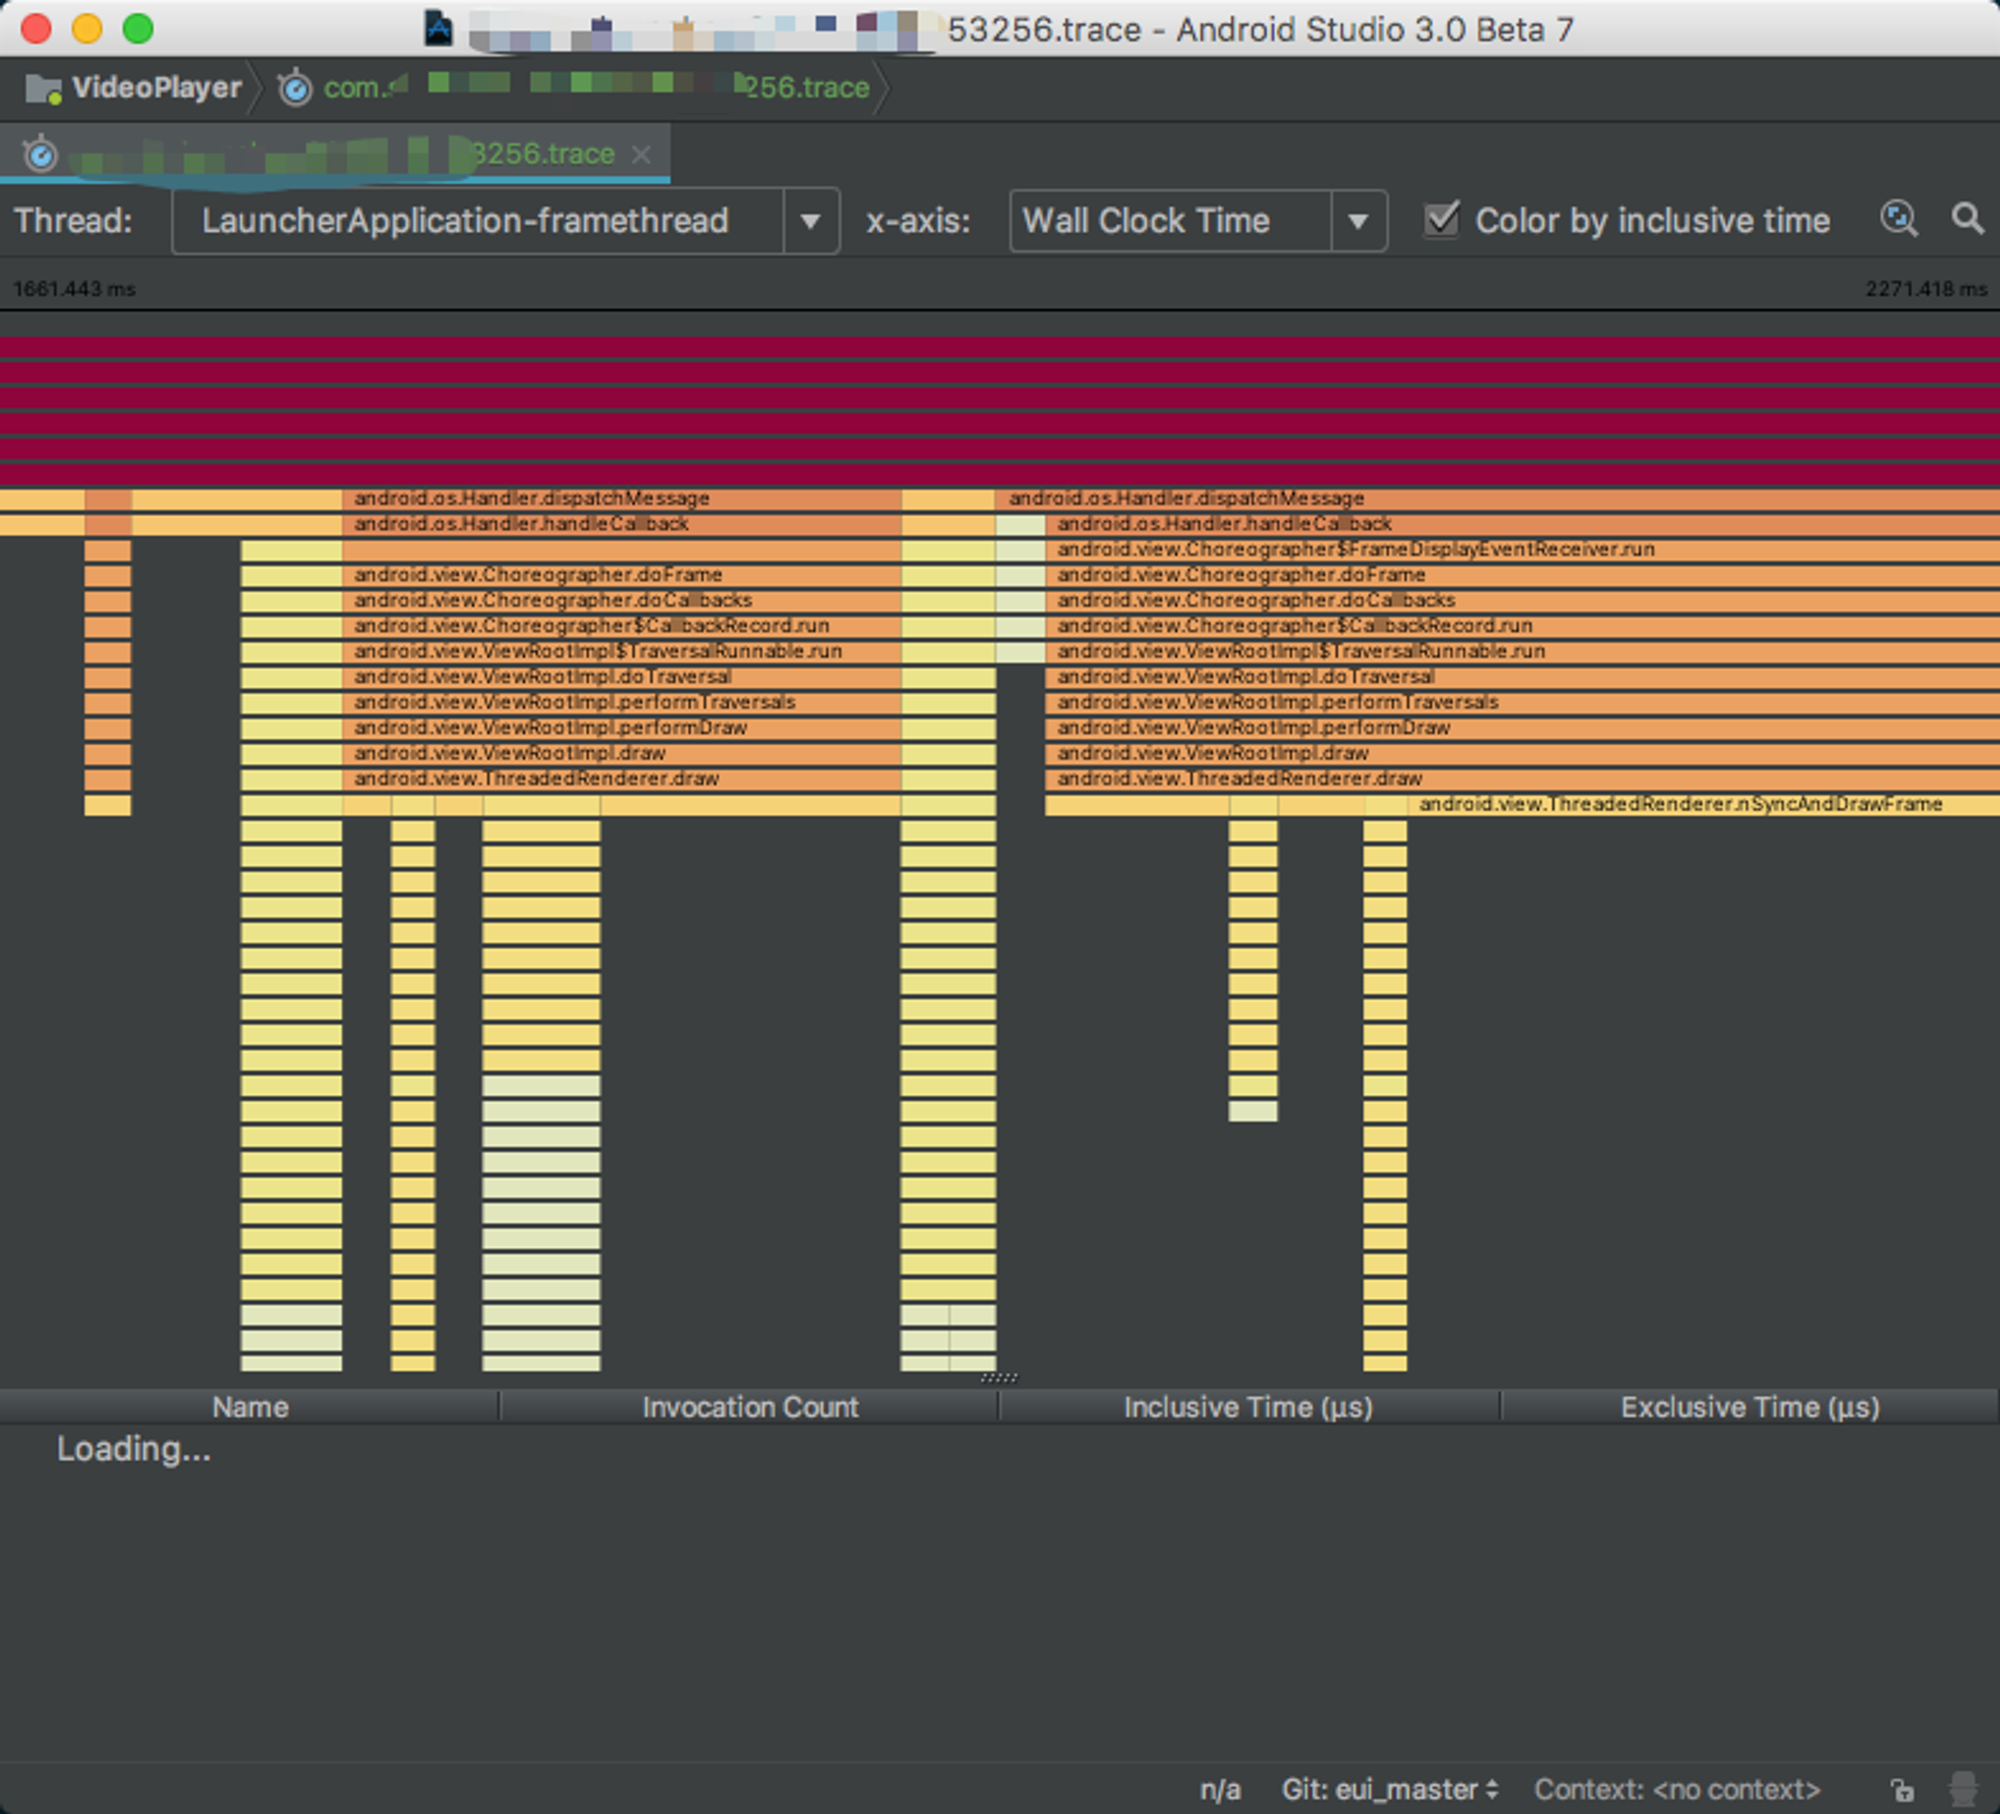
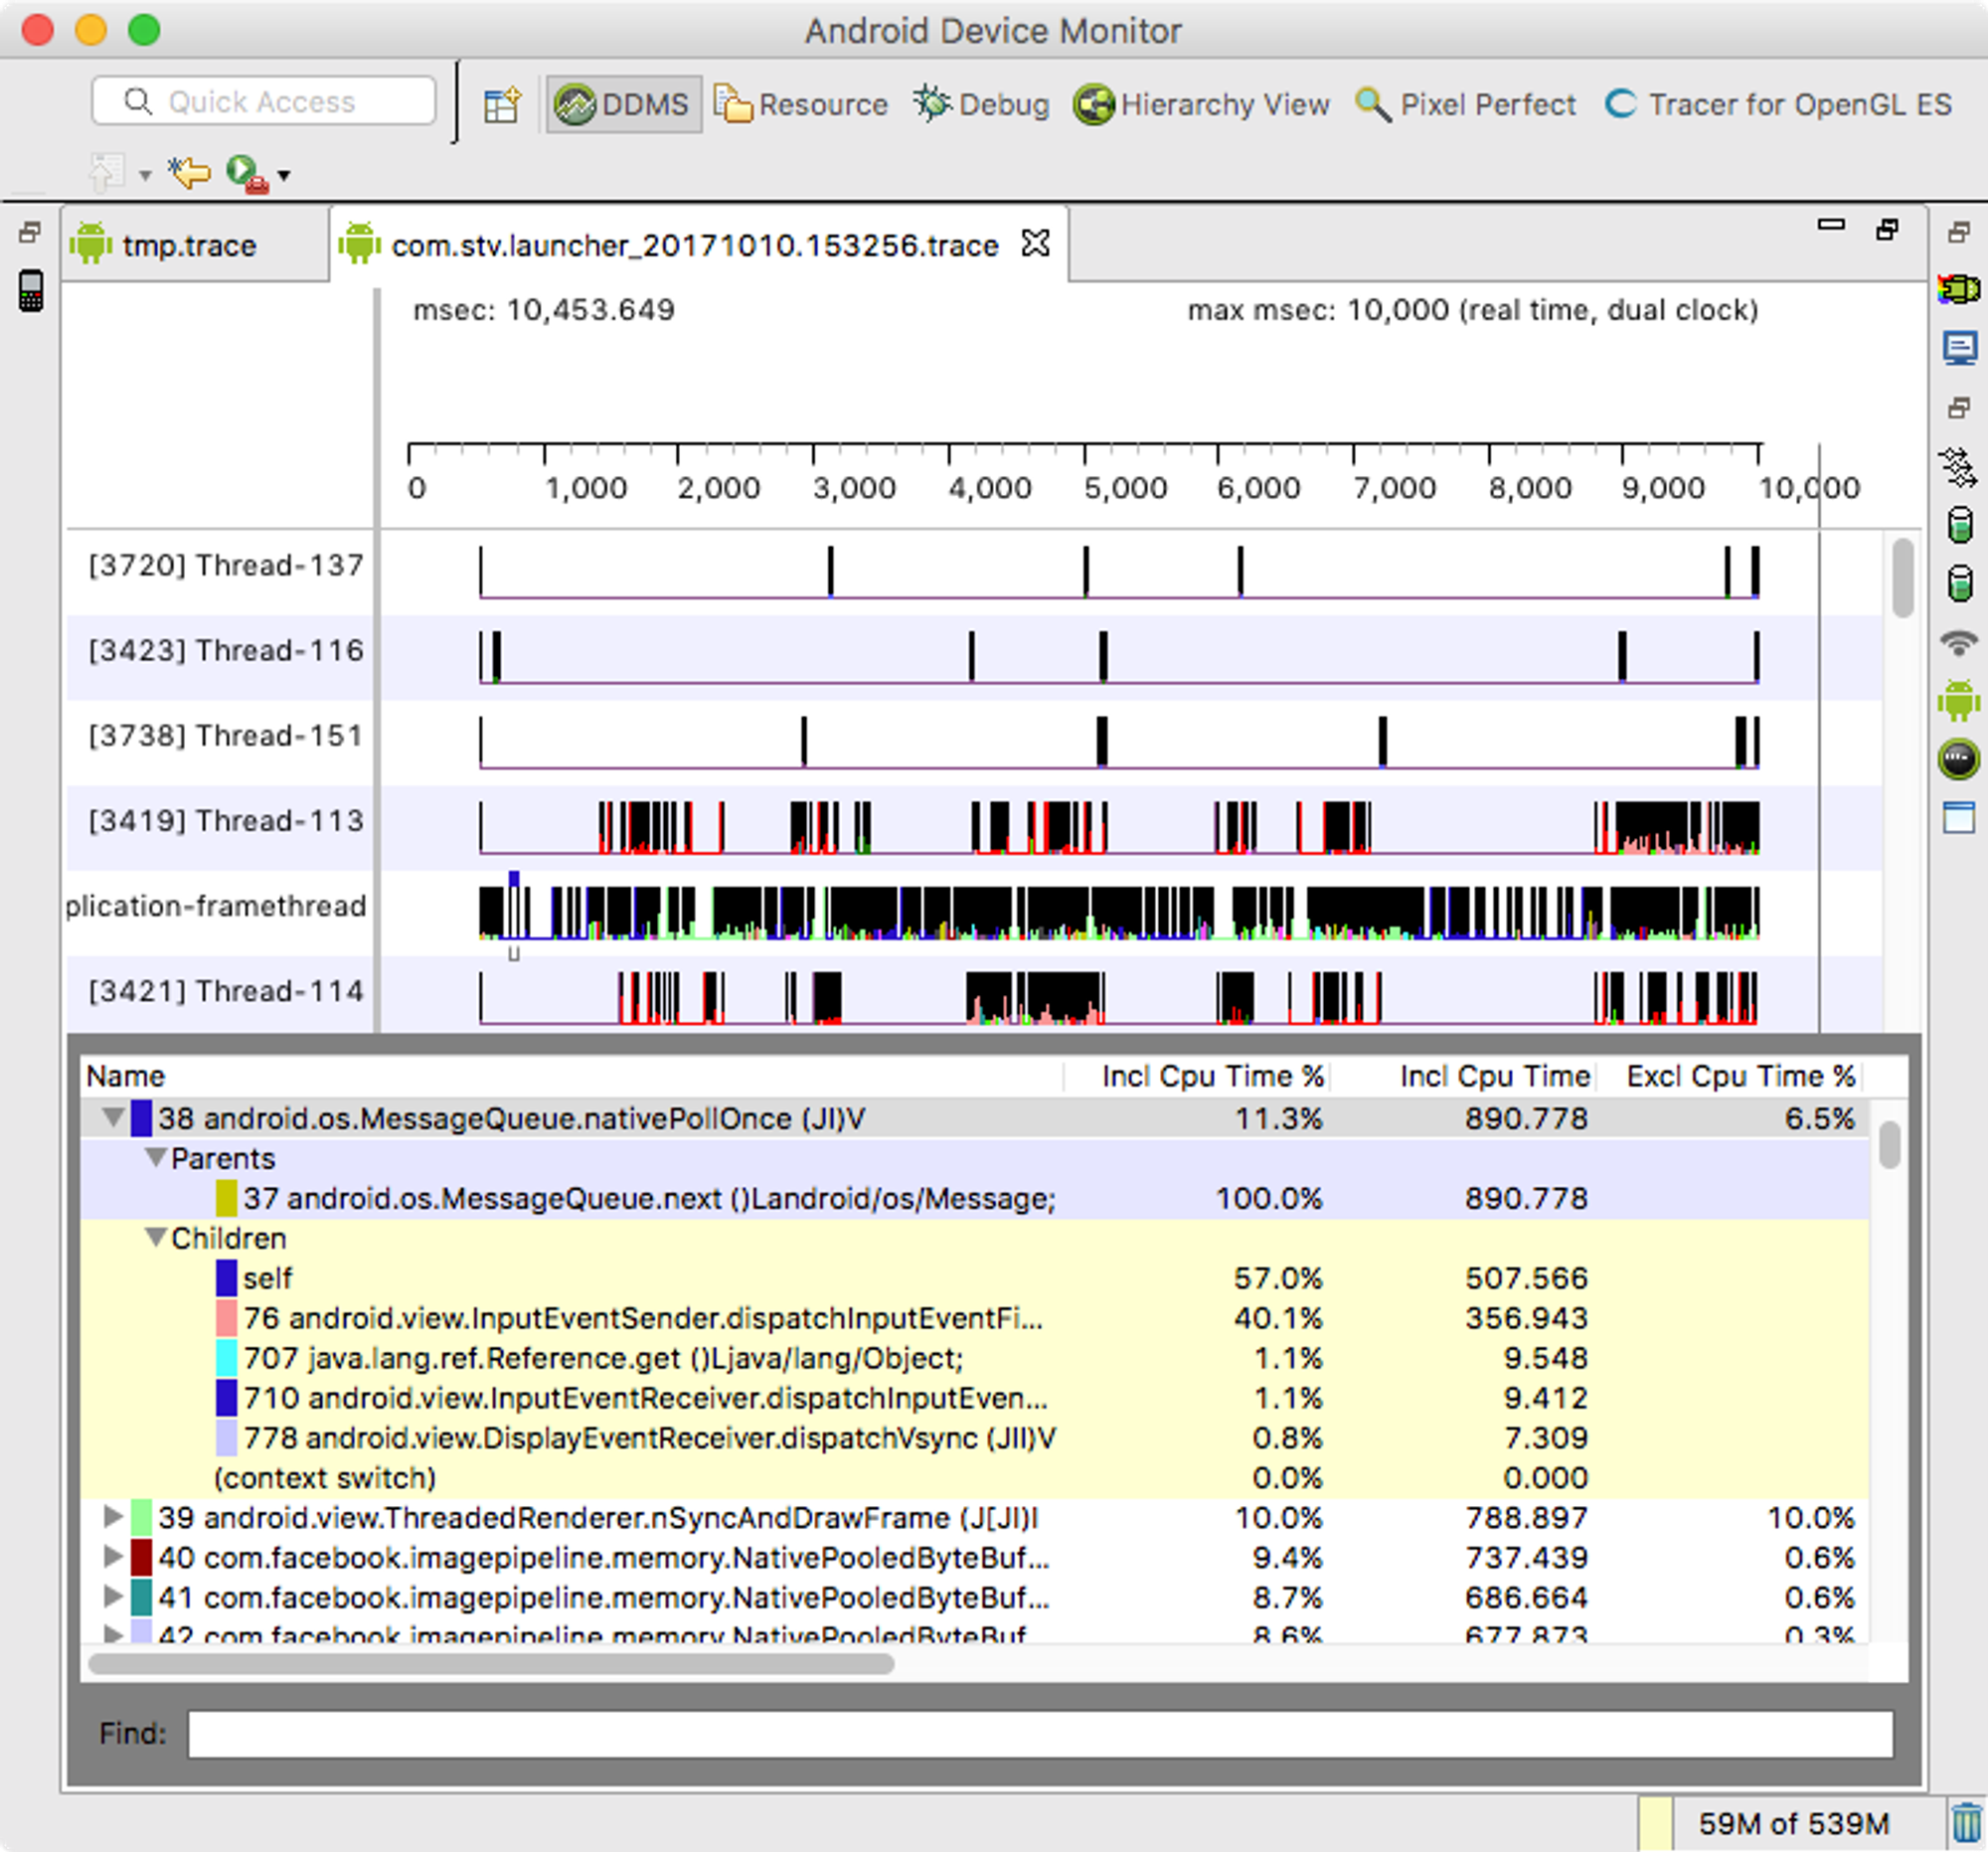
Trace Parsing/Reading
GUI
ddms or Android Studio 2.0/IntelliJ IDEA can directly open trace files, but they are not as user-friendly as the profiler in Android Studio 3.0.
Command Line Tool
Based on the above analysis I wrote a command line tool based on ddmlib to run Android Method Trace on the fly.